Offer: ADVANCED
Our ADVANCED offer helps you go beyond a simple dashboard. It ensures that various sources of data can work together thanks to automated workflows. It provides deeper analysis for a more data-driven decision approach.
Details
Data source
Data collection
Data processing
and
storage
Data visualisation
Tools
Training
Description
Number of data sources collected for the project.
Origin of the data sources collected. External data can be collected by export, API, web scraping…
Includes data cleaning, formatting, normalisation, anonymisation, aggregation, checks and controls...
The full process can be manual, semi-automated or fully automated.
Number of dashboards included. One dashboard has several indicators and graphs.
The tools for the different steps of the data collection, processing and visualisation can be market tools (API, Google Data Studio, Power BI, Tableau…) or be specifically developed for the project (Python, Dash Plotly, Django…).
Depending on the complexity and size of the process and tools, end users can be trained on how to use them.
Included
2+
First-party
and
external data
Semi-automated
or
automated
3+
Market Tool and customized development
Yes
Our projects
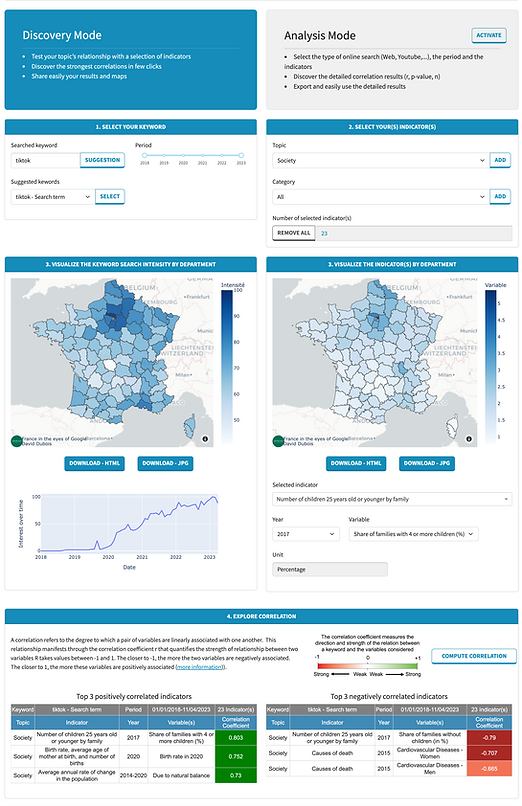
Google Trends Correlation Analysis Tool
INSEAD Business School
Industry: Education and Academic research
Business needs:
Analyse correlations between Google searches and macroeconomic and social indicators in France, United States and Japan.
Deliverable:
Multi-language Web App that allows users to:
-
Select keyword suggestions from Google Trends per period and search type,
-
Select indicator(s) linked to different topics (politics, macroeconomics, society, ESG) and/or categories (inequalities, purchasing power, election, immigration, health, environment...),
-
Visualise and export results on maps and graphs (jpg and html),
-
Compute, analyse and export correlation analysis with different level of details (exploration and analysis mode).
Methodology and tools:
-
Web app framework - Dash / Python,
-
Data transformation and correlation analysis – NumPy / Panda / SciPy,
-
Data Visualisation & Geolocation – Plotly Express.